


Used correctly, a CGM is one of the highest-leverage nutrition tools available. Used incorrectly – or interpreted without a framework – it produces data without direction. This protocol covers the full process: setup, baseline measurement, structured food testing, pattern identification, and translating findings into a sustainable, optimized eating structure.
Why CGM Data Outperforms Standard Nutrition Guidelines
The mechanism matters here. Postprandial (post-meal) glucose excursions drive insulin secretion, and repeated large excursions contribute to insulin resistance, fat storage, chronic inflammation, and mitochondrial stress over time. The problem is that individual glycemic responses vary significantly – a 2015 Weizmann Institute study (Zeevi et al., Cell) demonstrated that two people eating identical meals can have dramatically different glucose responses, driven by differences in gut microbiome composition, insulin sensitivity, meal timing, stress levels, sleep quality, and prior physical activity.
This is why generic dietary advice has limited precision. The CGM gives you n=1 data: your glucose response to your foods under your conditions. That data, interpreted systematically, is the foundation of a nutrition protocol that actually fits your biology.
Equipment and Setup
CGM Options for Non-Diabetic Users
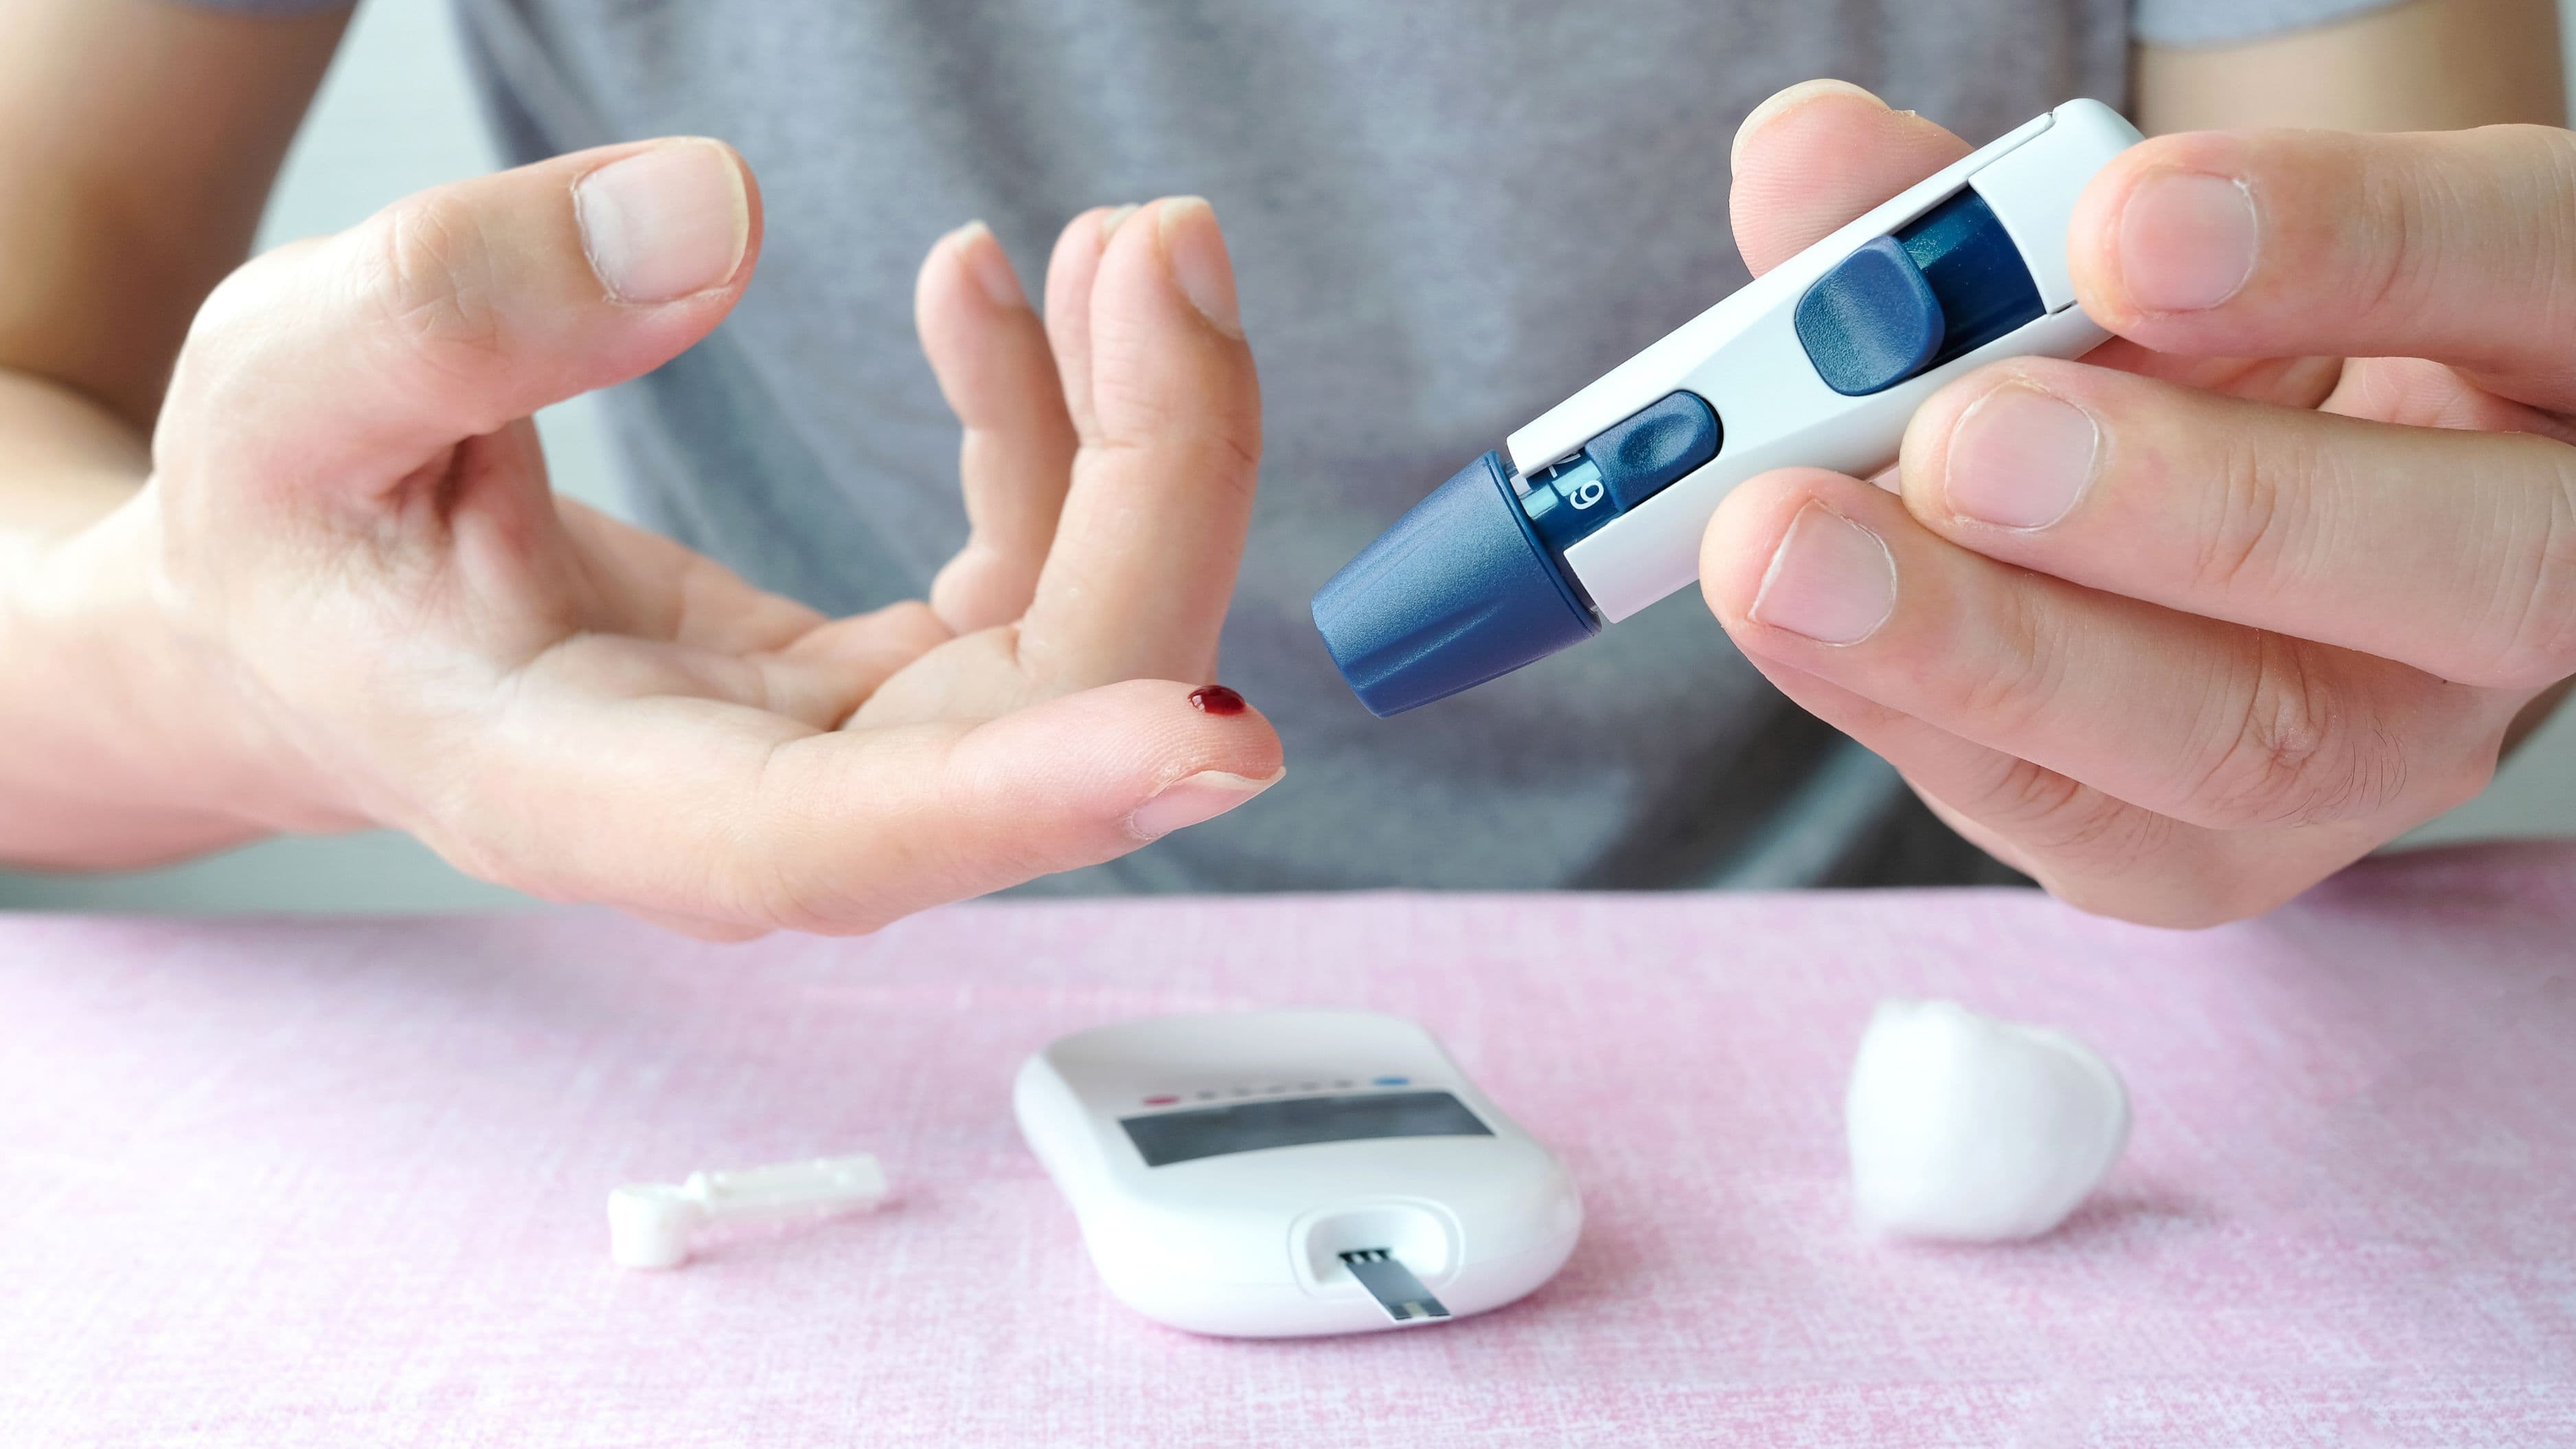
The two sensors most commonly used by non-diabetic performance-focused individuals are the Abbott Libre 3 and the Dexcom G7. Both provide continuous interstitial glucose readings every few minutes, sync to a smartphone app, and offer roughly 14 days of data per sensor. Neither requires a prescription in many US states, though availability varies. Third-party apps like Levels and Nutrisense layer interpretation and dietary logging on top of the raw sensor data, which significantly improves the actionability of what you're reading.
The Libre 3 tends to be more affordable per sensor and is widely used for short-term dietary experimentation. The Dexcom G7 offers slightly more consistent accuracy and real-time alerts. For the purpose of nutritional protocol building, either works.
Baseline Metrics to Establish Before Testing Foods
Before running any food experiments, spend your first 48–72 hours of sensor wear establishing baseline metrics:
Your fasting glucose reading – measured first thing in the morning before eating, drinking, or significant movement – should ideally sit between 70–90 mg/dL. Readings consistently above 95–100 mg/dL in a fasted state are a meaningful signal worth investigating. Your time in range (TIR), defined as the percentage of readings between 70–140 mg/dL, should be above 90% in a metabolically healthy individual. Your glucose variability – how much your glucose fluctuates throughout the day independent of meals – provides a baseline against which to measure meal-driven spikes.
Document these numbers. They are your metabolic baseline before the protocol begins.
Phase 1: Structured Food Testing (Days 1–14)
The goal of this phase is to generate reliable glucose response data for the foods that make up the majority of your current diet, as well as specific foods you want to evaluate for inclusion or exclusion.
Protocol for Testing Individual Foods
Test foods in isolation where possible. Eat the test food as a single meal or snack with no other macronutrients mixed in, and consume a standardized portion (the amount you would realistically eat). Log the start time, food, and portion size in your tracking app. Measure your glucose:
At baseline (just before eating)
At 30 minutes post-meal
At 60 minutes post-meal
At 120 minutes post-meal (return to baseline is the target)
The key metrics from each test are: peak glucose value (how high did it go), peak timing (when did it peak), delta from baseline (how many mg/dL above your pre-meal reading), and return time (how long to return within 10 mg/dL of baseline). A well-tolerated food produces a modest peak (ideally under 140 mg/dL absolute, under 30 mg/dL delta), a peak at 45–60 minutes, and a clean return to baseline within 90–120 minutes. A poorly tolerated food produces a spike above 140–160 mg/dL, a prolonged elevated period, or a reactive hypoglycemic dip below baseline after the return.
Priority Foods to Test
Start with the foods that represent the largest carbohydrate load in your current diet. Common high-yield tests include:
White rice vs. basmati rice vs. parboiled rice. Oats (steel-cut vs. rolled vs. instant). White bread vs. sourdough vs. sprouted grain bread. Sweet potato vs. white potato vs. potato that has been cooked and cooled (retrograde starch formation changes glycemic response significantly). Fruit – particularly banana, mango, and grapes versus berries. Pasta (standard vs. cooked al dente vs. cooked, cooled, and reheated). Sports nutrition products – gels, bars, drinks – if you use them.
Test each food at minimum twice before drawing conclusions, as day-to-day variation in glucose response is real. Identical foods eaten on a high-stress day versus a low-stress day, or following poor sleep versus adequate sleep, can produce meaningfully different responses.
Phase 2: Contextual Variable Testing (Days 10–21)
Raw food response data is useful. Contextual variable testing is what separates a basic dietary experiment from a genuine optimization protocol. The same food eaten under different conditions can produce dramatically different glucose responses. This phase systematically examines those variables.
Meal Timing and Circadian Glucose Patterns
Glucose tolerance is not constant throughout the day. Insulin sensitivity is generally highest in the morning and declines through the afternoon and evening – a phenomenon driven by circadian variation in insulin secretion and peripheral glucose uptake. Test the same standardized meal (e.g., a fixed portion of white rice or oatmeal) eaten at three different times: morning (7–8 AM), midday (12–1 PM), and evening (7–8 PM). Most people will see progressively larger glucose excursions as the day advances. This finding has direct implications for meal composition timing: if you're going to eat higher-carbohydrate meals, front-loading them earlier in the day is generally the higher-performance choice.
Physical Activity Timing
A brisk 10–15 minute walk following a meal meaningfully attenuates postprandial glucose spikes by driving GLUT-4 translocation in muscle tissue and increasing glucose uptake independent of insulin. Test your highest-carbohydrate meal both with and without a post-meal walk to quantify the actual effect in your own data. For most people, this single behavioral variable produces a 20–40 mg/dL difference in peak glucose from the same meal. Similarly, testing a meal following a resistance training session versus on a rest day will typically show significantly improved glucose tolerance in the post-training window.
Sleep Quality Impact
Track your fasting glucose against your sleep data for the duration of your sensor wear. Nights where sleep was short (under six hours) or significantly disrupted typically produce elevated fasting glucose the following morning and blunted glucose tolerance throughout that day. If you use a sleep tracker alongside your CGM, this relationship will be visible in your data. It is not subtle. The implication for protocol design is that carbohydrate intake on poor-sleep days should be managed more conservatively than on well-rested days.
Stress State
Cortisol is glucogenic – it drives hepatic glucose output independent of dietary intake. A high-stress day will elevate your baseline glucose and amplify your response to carbohydrates eaten under that stress. This is relevant for protocol design because it explains why a meal that produces a clean response on a normal day produces an exaggerated one on a high-pressure workday. Accounting for stress state when interpreting food responses prevents you from misattributing stress-driven spikes to the food itself.
Phase 3: Protocol Construction
With two to three weeks of structured data, you now have enough information to build a personalized nutrition framework. The protocol construction process has four components.
Identify Your Tolerance Tiers
Sort your tested foods into three tiers based on your glucose response data:
Tier 1 – Well-tolerated: Foods that consistently produce a peak delta under 25–30 mg/dL, peak below 130 mg/dL, and return cleanly to baseline within 90 minutes. These are the carbohydrate and mixed-food sources that form the backbone of your diet.
Tier 2 – Contextually tolerated: Foods that produce larger responses (delta 30–50 mg/dL) but within acceptable absolute ranges. These are appropriate when combined with strategic mitigating variables – post-meal activity, lower overall carbohydrate load at that meal, earlier timing in the day, or better sleep the night before.
Tier 3 – Poorly tolerated or situational: Foods that consistently produce large spikes, prolonged elevation, or reactive dips. These don't need to be permanently eliminated, but they require specific conditions to use without penalty – or simply represent foods your metabolism handles poorly regardless of context.
Set Your Glucose Performance Targets
Based on your baseline data and tolerance testing, establish your personal glucose performance targets:
Fasting glucose target: 70–90 mg/dL. Post-meal peak target: under 140 mg/dL absolute, under 30 mg/dL above your pre-meal baseline. Time in range target: above 90% of readings between 70–140 mg/dL. Glucose variability: coefficient of variation (CV) below 36% is the standard clinical threshold for stable glucose dynamics.
These targets give your ongoing nutrition decisions a clear feedback mechanism.
Design Your Meal Structure
Using your tolerance tier data and contextual variable findings, design your default daily meal structure:
Highest-carbohydrate meal placed in the morning or around resistance training, when glucose tolerance is highest. Protein and fat anchored in each meal to blunt glucose excursion from carbohydrate sources. Post-meal movement (10–15 minutes walking) built into your routine following your highest-carbohydrate meal of the day. Conservative carbohydrate approach on poor-sleep and high-stress days, substituting Tier 1 sources for any Tier 2 foods you would normally include.
Calibrate Portions, Not Just Foods
One finding most CGM users encounter is that portion size matters as much as food choice. A small portion of a Tier 2 food may produce a Tier 1 response; a large portion of a Tier 1 food can exceed your targets. Use your data to identify approximate portion thresholds for the foods you eat regularly. This converts generic dietary guidance into specific, quantified parameters that match your actual biology.
Expected Results and Realistic Timeline
After two weeks of structured testing: a clear food tolerance map and identification of your primary glycemic triggers. After four weeks of protocol application: measurable improvement in time in range and glucose variability in most users, along with subjective improvements in energy stability and reduced afternoon cognitive decline. After eight to twelve weeks: these improvements consolidate and begin to show up in downstream markers – fasting insulin, HbA1c (if you retest), body composition, and training performance.
The CGM itself does not need to be worn continuously after the initial protocol-building phase. Periodic re-testing (two weeks every quarter, or following significant lifestyle changes) is sufficient to keep the protocol calibrated. Many users find two to three CGM cycles per year adequate for maintenance and refinement.
Common Mistakes and What to Avoid
Testing too many foods simultaneously without isolation periods produces noise rather than insight. A meal with six ingredients tells you nothing specific about which component drove the response. Isolate first, then combine.
Overreacting to single-day anomalies is equally counterproductive. One elevated reading from an otherwise well-tolerated food usually reflects a confounding variable – stress, poor sleep, dehydration, illness – rather than a genuine intolerance. Reproducibility across multiple tests is the standard for protocol decisions.
Ignoring the protein and fat context of a meal is a common interpretive error. Fat slows gastric emptying and can delay glucose absorption, flattening peaks but extending the duration of elevation. A fatty meal may show a deceptively flat immediate response but still deliver significant glucose load over a longer window. Whole-meal testing under realistic eating conditions is ultimately more actionable than purely isolated testing for habitual foods.
Finally, don't confuse glucose response with overall metabolic health. A chronically low glucose response to all foods can reflect either excellent insulin sensitivity or, in some contexts, other metabolic dysregulations. CGM data is one input among several. Fasting insulin, HOMA-IR, and lipid panel data provide complementary context that a CGM alone cannot supply.
FAQ
Do I need a prescription to use a CGM? In most US states, Abbott Libre sensors can be purchased over the counter or through services like Levels without a prescription. Dexcom typically requires one. Availability varies by state and is evolving as over-the-counter CGM access expands.
How many CGM cycles do I need to build a reliable protocol? One 14-day sensor is sufficient to establish a usable baseline and test your primary foods. Two cycles (28 days total) significantly improves data reliability and allows for contextual variable testing that a single sensor doesn't fully cover.
Is CGM data accurate enough for protocol-level decisions? Interstitial fluid glucose measured by CGM lags capillary blood glucose by approximately 5–15 minutes. Accuracy is generally within 10–15 mg/dL of fingerstick readings. For population-level clinical diagnostics, this precision gap matters more. For the purpose of identifying your personal food responses and behavioral patterns, the accuracy is more than sufficient – the relative differences between foods and contexts are what drive protocol decisions, and those are reliably captured.
Should I track macros alongside CGM data? Yes. Logging macronutrient intake alongside glucose responses allows you to identify whether your responses are primarily driven by total carbohydrate load, carbohydrate quality, meal composition ratios, or timing. Without macro context, you can identify that a response occurred but not always why.
The Bottom Line
A CGM turns nutrition from guesswork into engineering. The protocol above – baseline establishment, isolated food testing, contextual variable mapping, and systematic protocol construction – takes approximately three to four weeks to execute properly and produces a personalized nutrition framework that generic dietary advice cannot replicate. The investment is front-loaded; the benefit is a dietary structure calibrated to your actual metabolic response rather than to population averages that may not describe you at all.
Run the protocol once correctly and you have a nutrition framework that holds up indefinitely, with periodic recalibration as your body composition, training, and life circumstances change.
📚 Sources
Zeevi D et al. – Personalized Nutrition by Prediction of Glycemic Responses, Cell 2015: https://www.cell.com/cell/fulltext/S0092-8674(15)01481-6
American Diabetes Association – Time in Range as a Clinical Outcome Measure: https://diabetesjournals.org/care/article/42/8/1593/36190/Time-in-Range-as-a-Quality-Metric-in-the-Management
Colberg SR et al. – Exercise and Type 2 Diabetes, Diabetes Care 2010 (GLUT-4 mechanism): https://diabetesjournals.org/care/article/33/12/e147/38359/Exercise-and-Type-2-Diabetes
Leproult R & Van Cauter E – Role of Sleep and Sleep Loss in Hormonal Release and Metabolism, Endocrine Development 2010: https://www.ncbi.nlm.nih.gov/pmc/articles/PMC3065172/
Battram DS et al. – Glycemic Response to Resistant Starch in Cooked and Cooled Potatoes, European Journal of Clinical Nutrition 2021: https://www.nature.com/articles/s41430-020-00795-w