If you're training hard, managing high cognitive demand, or optimizing for longevity and hormonal health, HRV deserves more attention than you're probably giving it. Not as a curiosity, but as a primary lens for decision-making.
What HRV Actually Measures
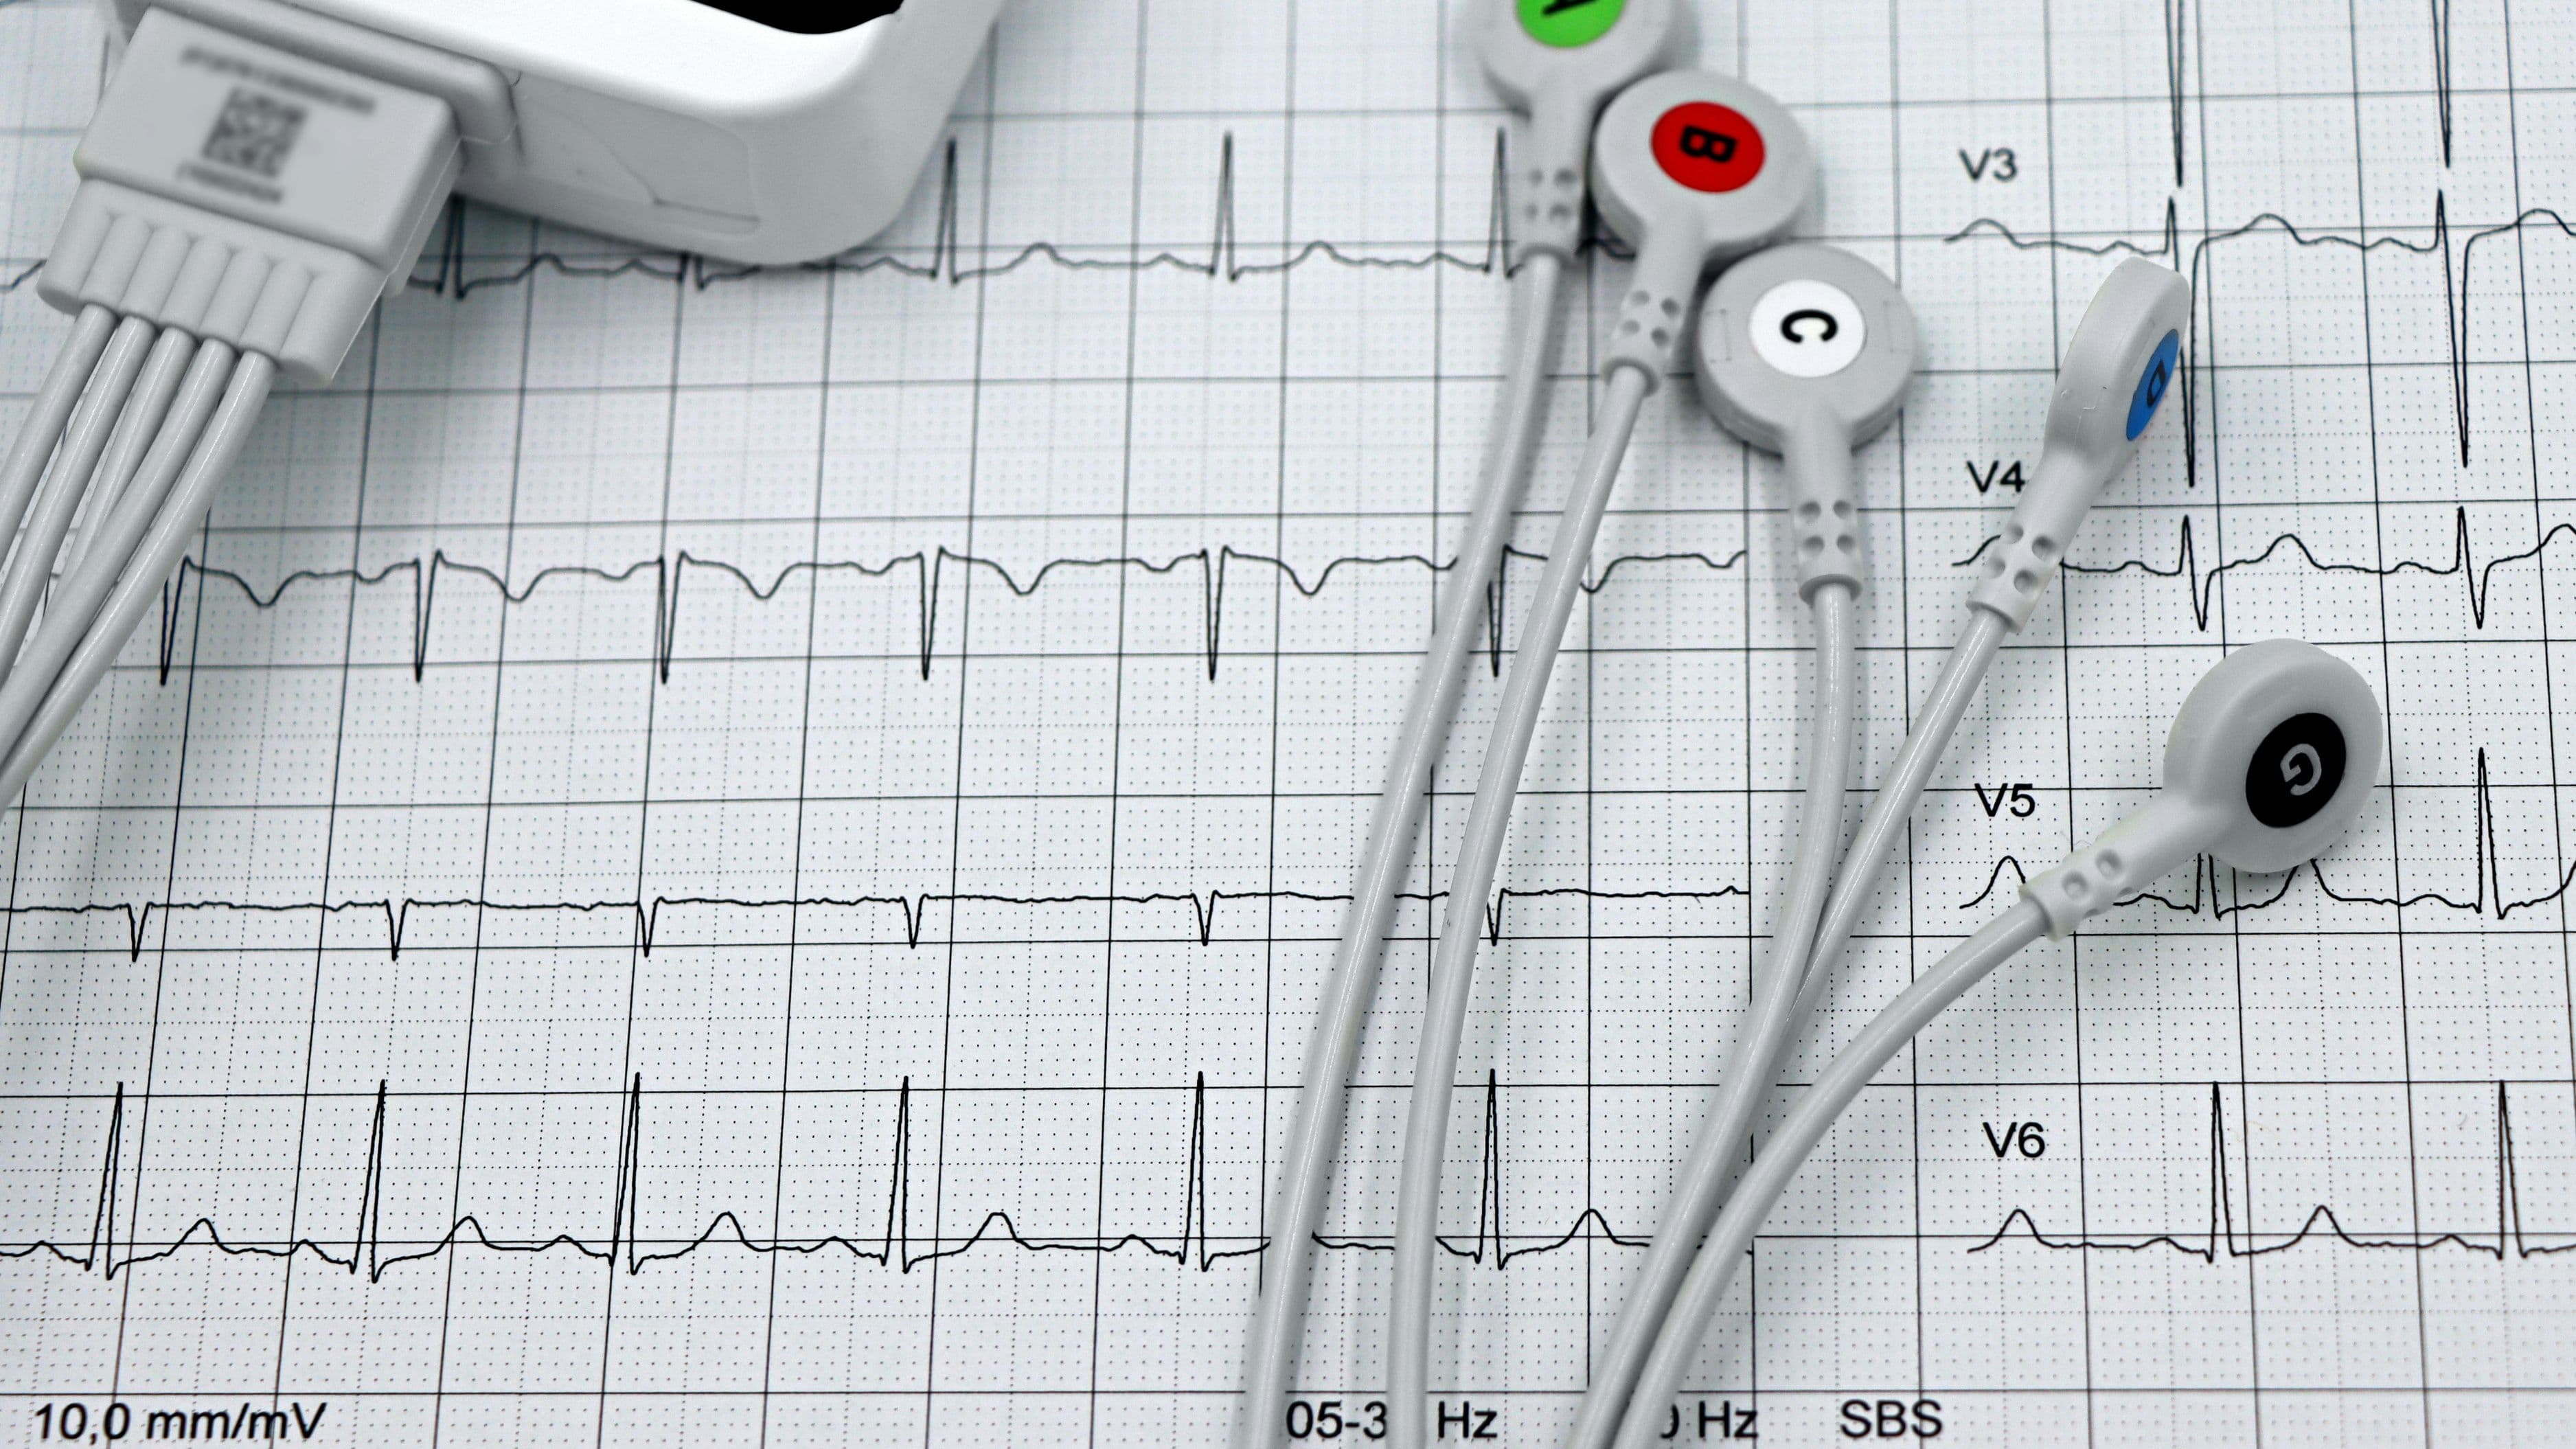
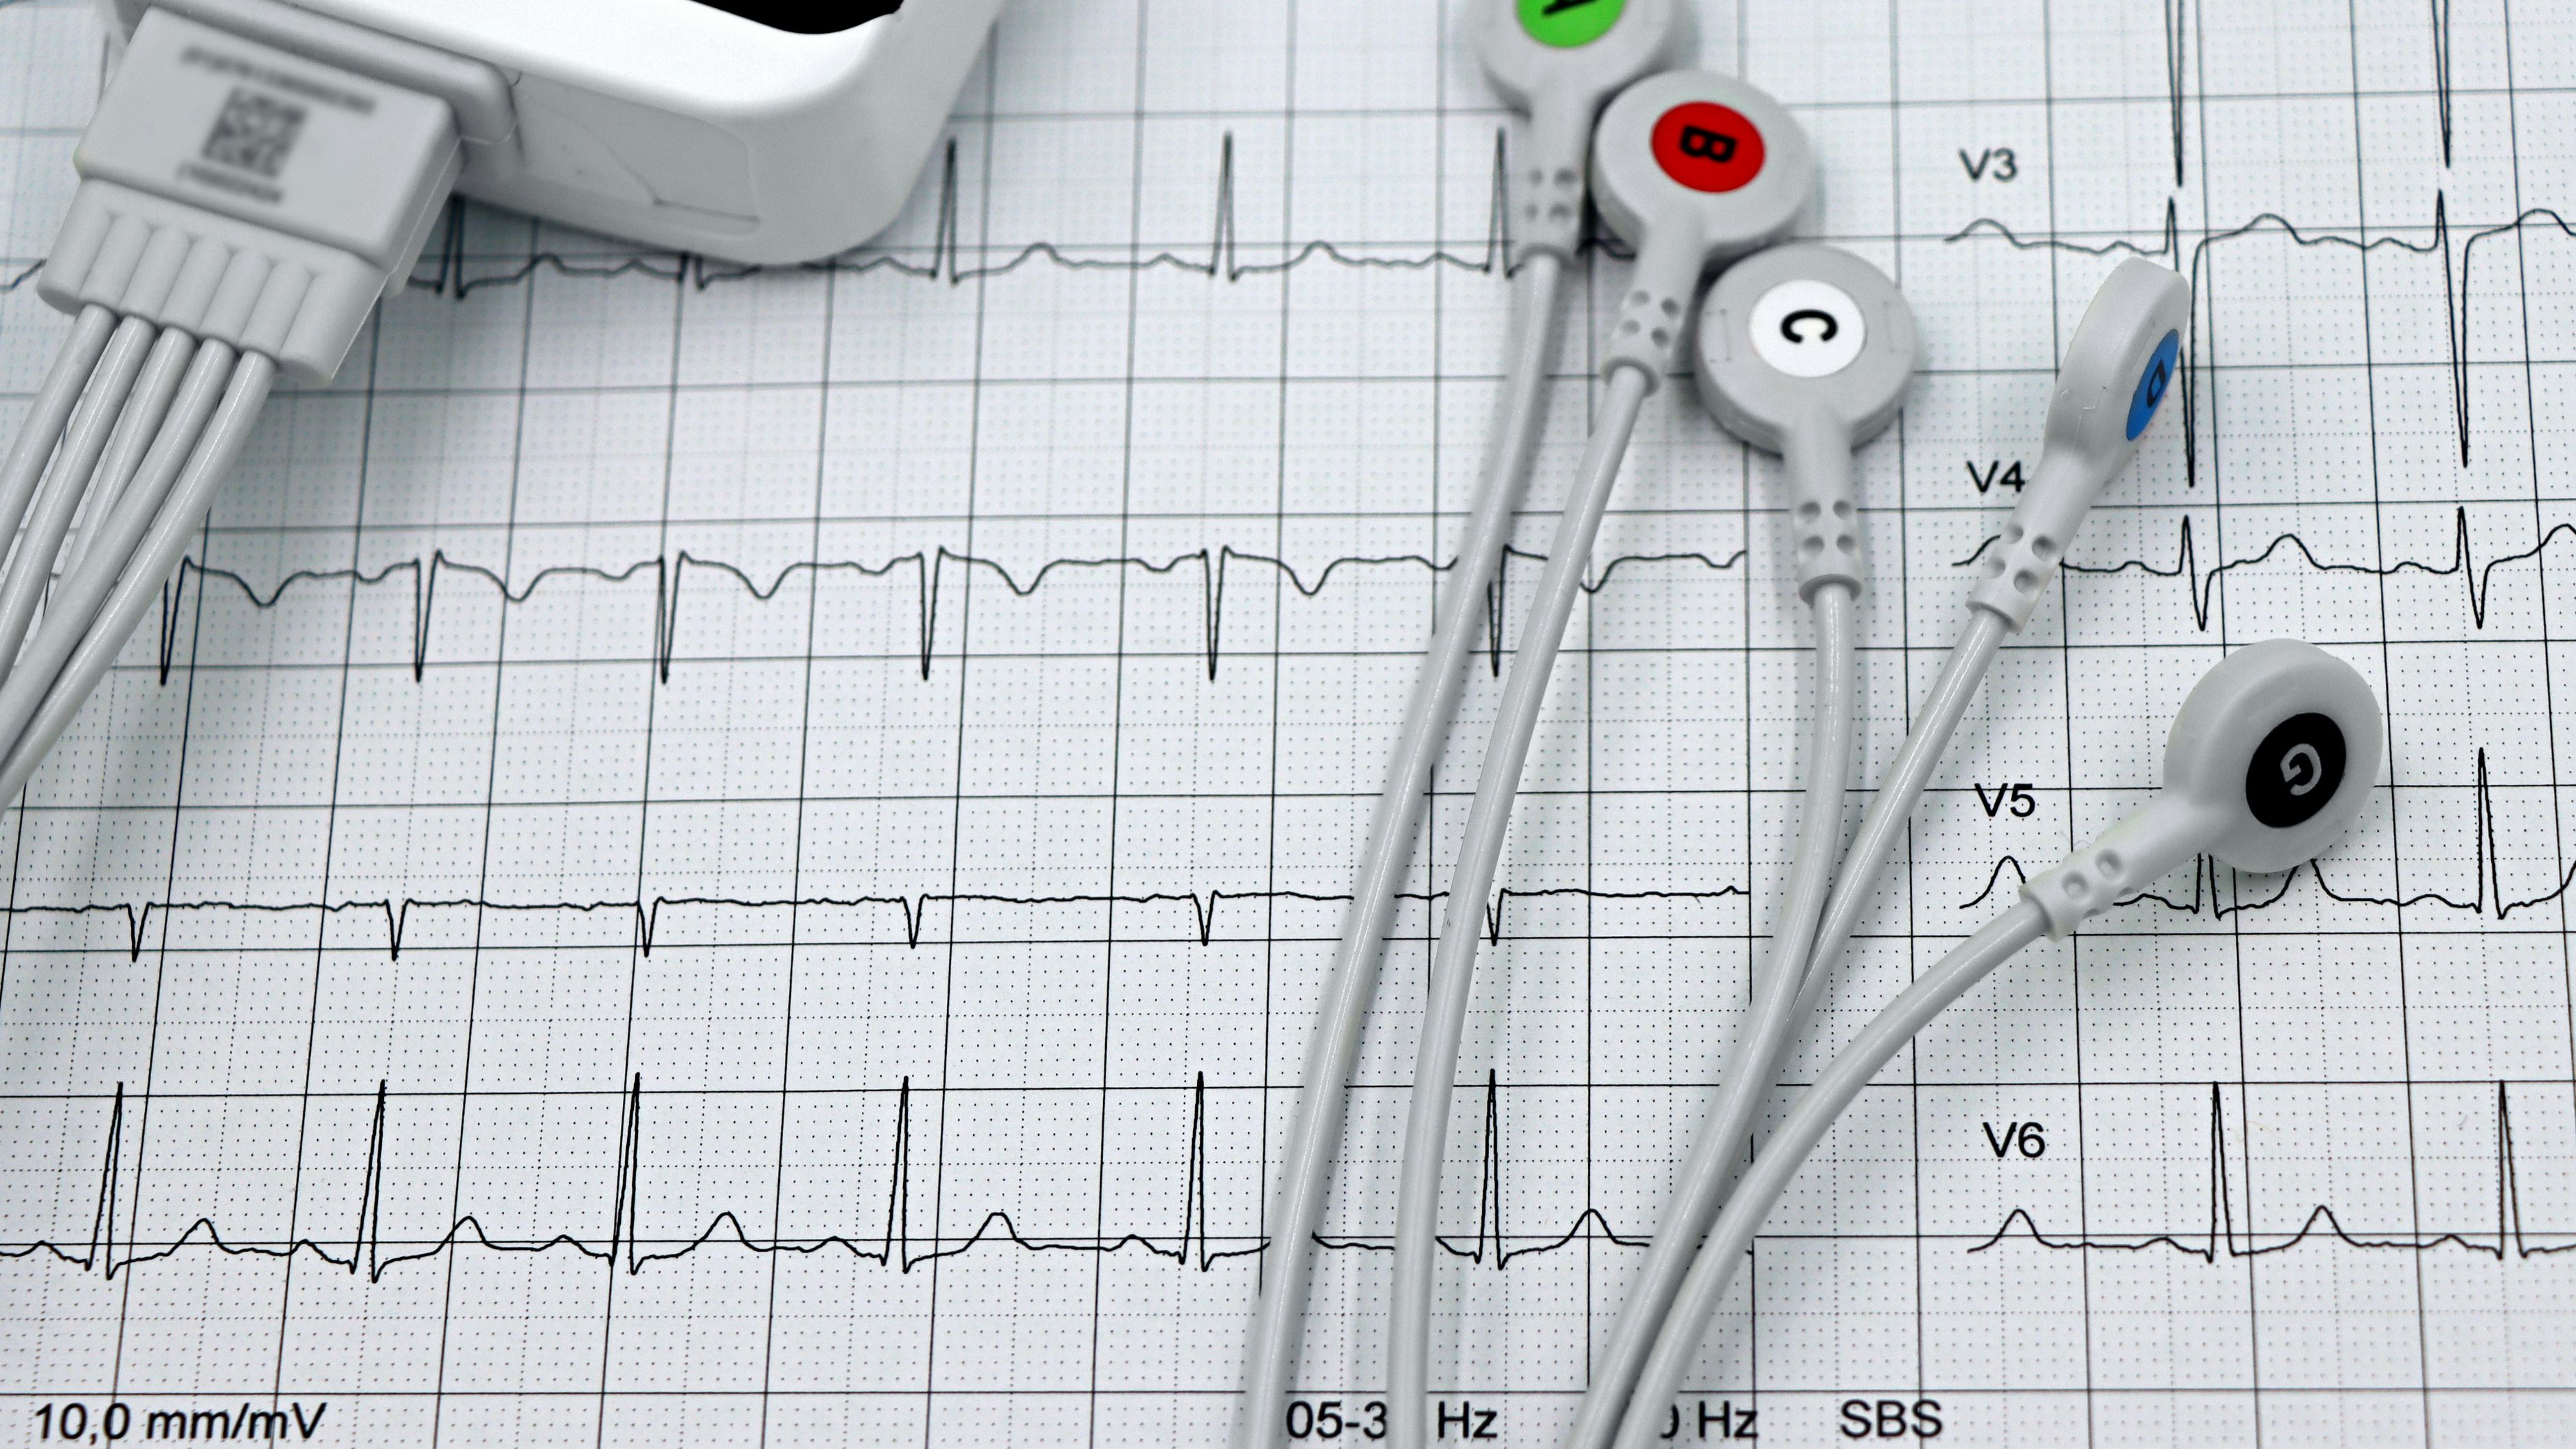
Heart rate variability is the variation in time between consecutive heartbeats. That interval – called the R-R interval, measured in milliseconds – is not constant. A heart beating at 60 bpm doesn't produce a beat exactly every 1,000ms. The actual intervals fluctuate, and the degree of that fluctuation is your HRV.
This fluctuation is not noise. It's a direct output of the autonomic nervous system (ANS), specifically the dynamic balance between the sympathetic (fight-or-flight) and parasympathetic (rest-and-digest) branches. The vagus nerve – the primary conduit of parasympathetic signaling to the heart – modulates the R-R interval in real time. When parasympathetic tone is high, variability increases. When sympathetic tone dominates – during stress, illness, overtraining, or poor sleep – variability drops.
This is why HRV functions as a readout of systemic load rather than just cardiovascular state. Your autonomic nervous system integrates inputs from every major physiological system: immune, endocrine, metabolic, cognitive. When any of those systems is under strain, it registers in the ANS balance, and that balance shows up in your HRV.
The most commonly used HRV metric is RMSSD – the root mean square of successive differences between R-R intervals. It's heavily weighted toward parasympathetic activity and is the metric used by most consumer wearables including Whoop, Garmin, and Apple Watch. SDNN (standard deviation of all R-R intervals) is broader and captures total autonomic variability; it's more common in clinical settings. For performance and recovery tracking, RMSSD is the number that matters most.
Why It Outperforms Other Recovery Metrics
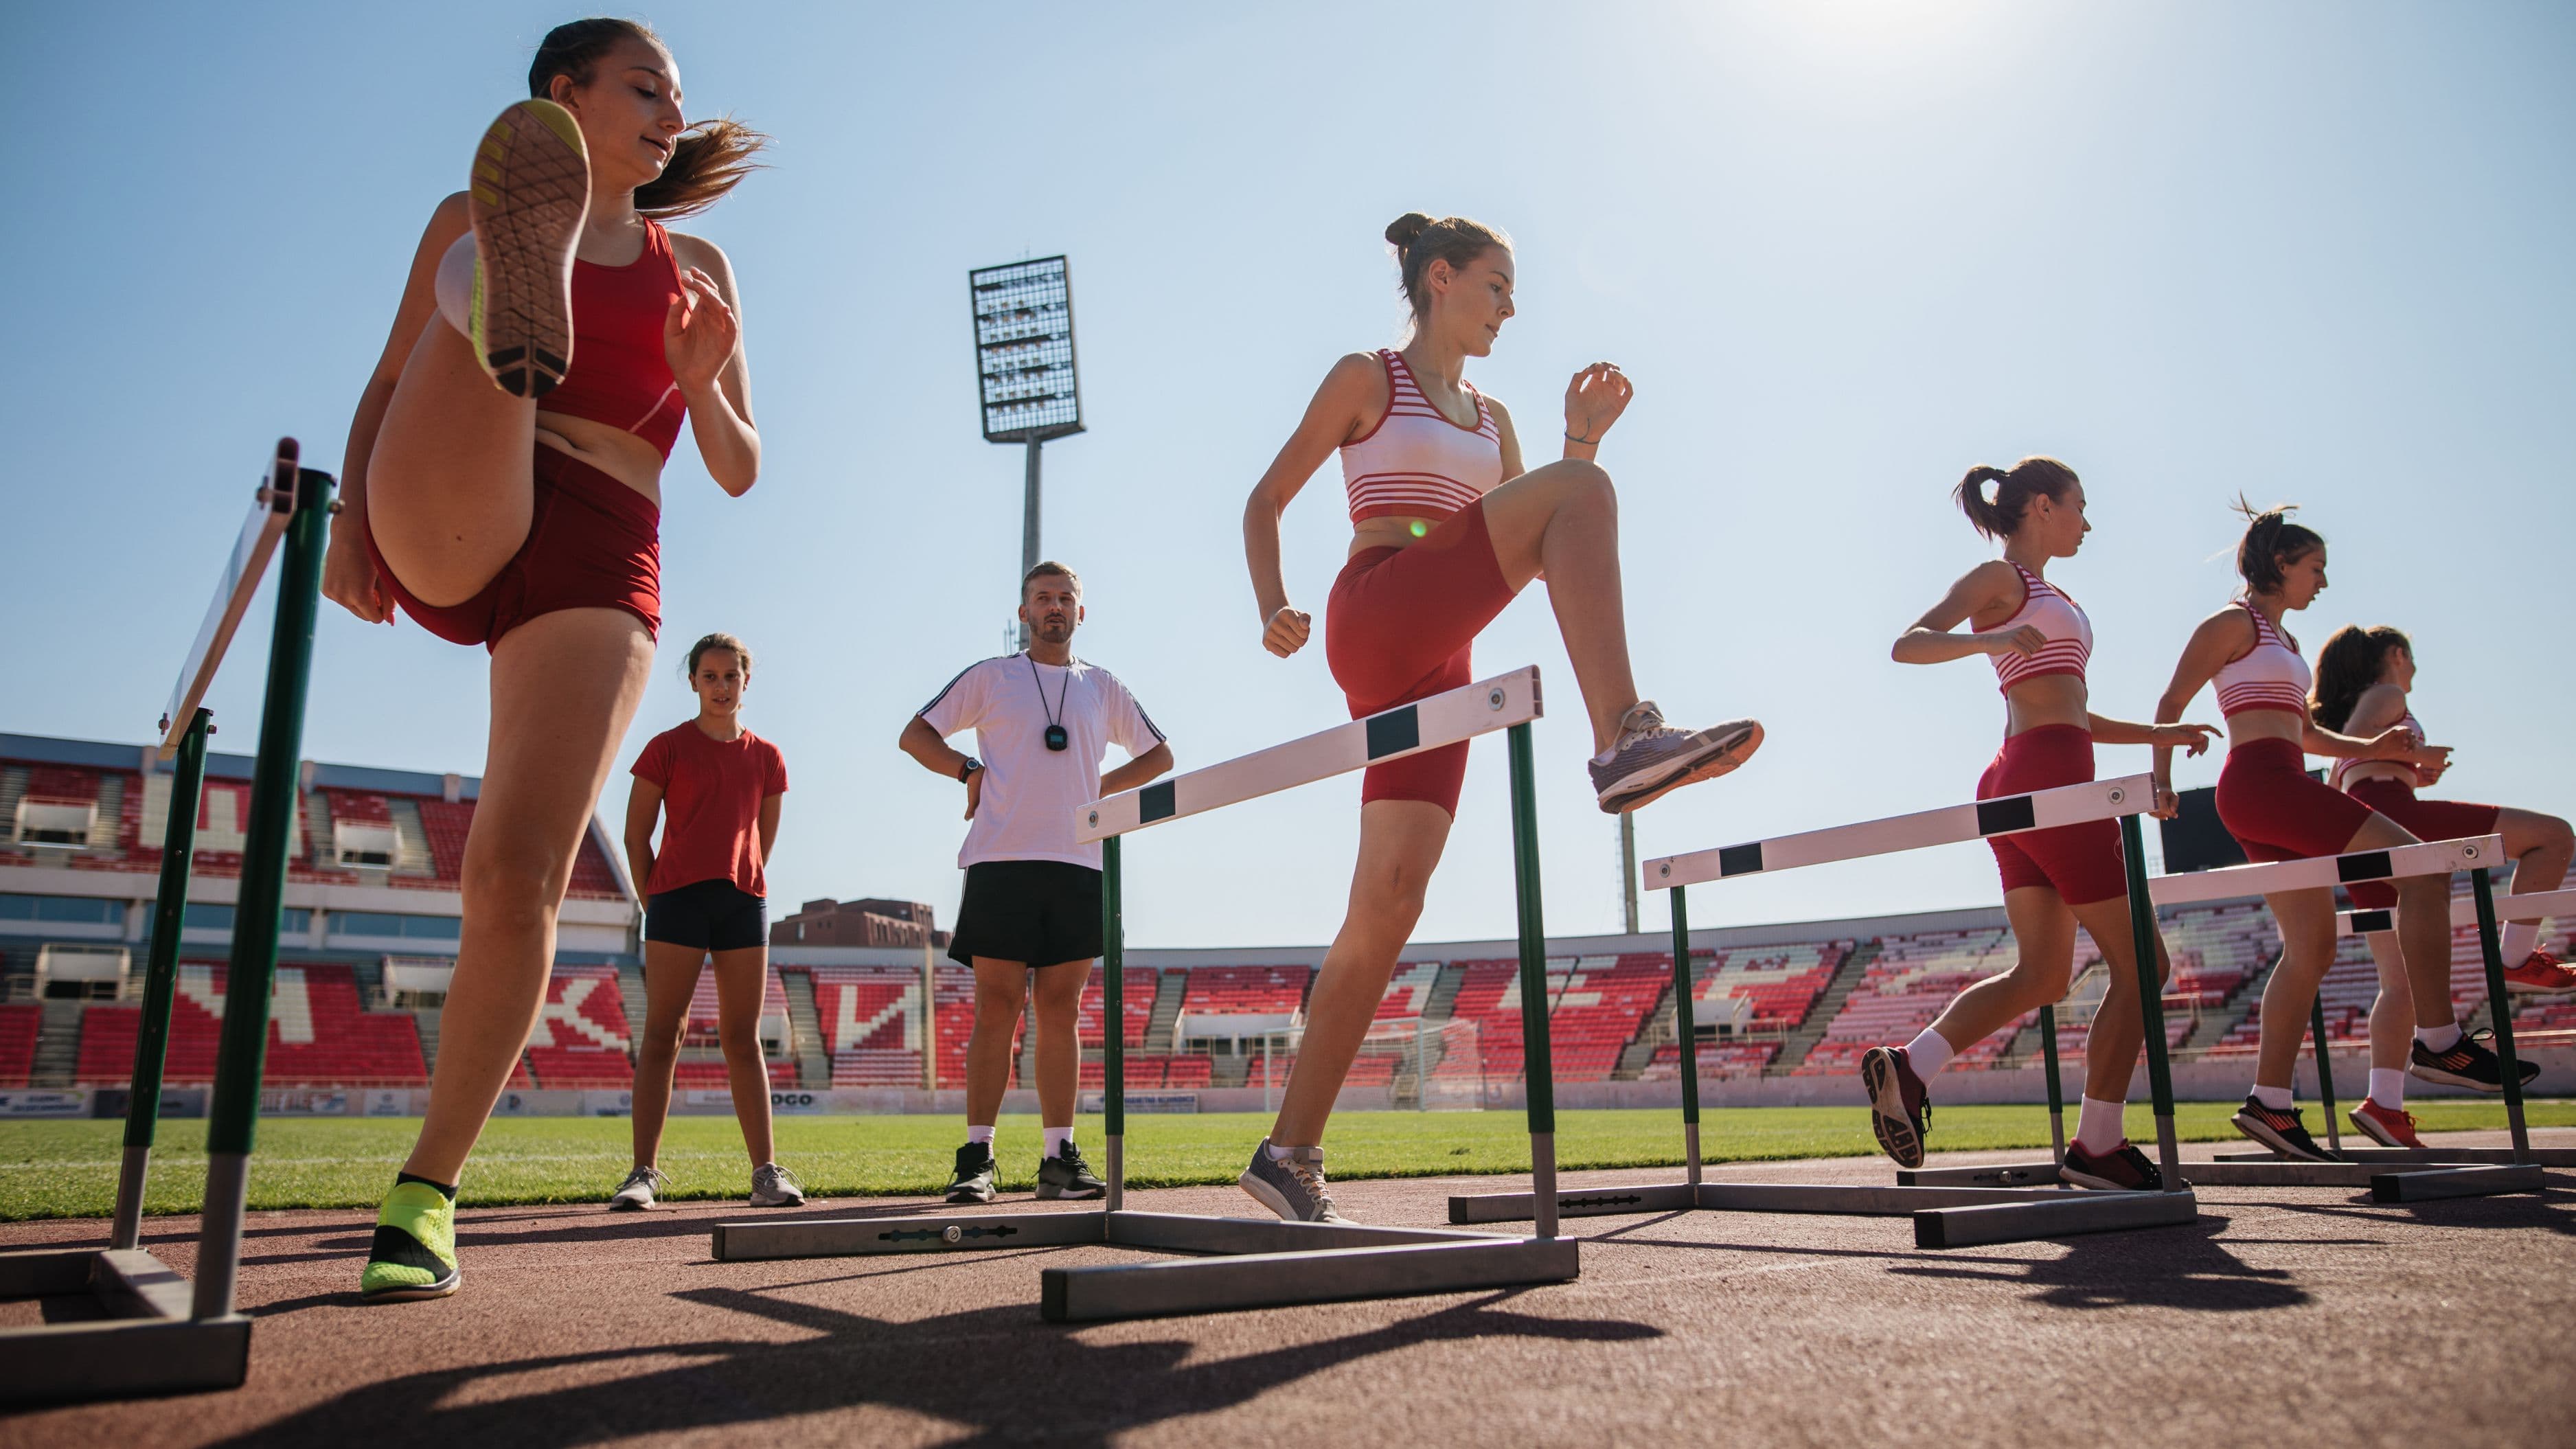
Subjective feel is notoriously unreliable as a readout of physiological readiness. Research consistently shows that athletes overestimate their recovery status after high-intensity training, particularly when motivation is high. You can feel ready to train while your body is still deep in the repair process. HRV doesn't share that bias.
Resting heart rate (RHR) is a useful baseline metric, but it's a blunter instrument. RHR reflects general cardiovascular fitness and gross autonomic tone, but it changes slowly and lacks the sensitivity to detect acute changes in recovery status that HRV captures. A spike in resting heart rate by 5–7 bpm can signal stress or illness, but HRV will typically flag the same issue earlier and with more specificity.
Sleep trackers give you duration and staging data, which matters. But two nights of 8-hour sleep can produce very different physiological outcomes depending on sleep quality, alcohol, stress, or immune activation – differences that HRV will reflect and duration metrics won't. HRV measured on waking integrates the quality of the preceding night far more accurately than sleep stage data alone.
Cortisol curves, testosterone levels, and inflammatory markers give you deeper mechanistic data, but they require blood draws and either lab testing or expensive home diagnostics. HRV is a real-time, non-invasive proxy for the same underlying systems. It won't replace periodic bloodwork, but it extends the resolution of your feedback loop to every morning.
The Mechanism Behind the Numbers
Understanding why HRV reflects what it does makes you a better interpreter of your own data.
The autonomic nervous system operates on a push-pull dynamic. Sympathetic activation suppresses HRV by increasing heart rate and reducing parasympathetic modulation of the sino-atrial node. Parasympathetic activation does the opposite – it slows heart rate and increases beat-to-beat variability through vagal input. In a well-recovered, low-stress state, vagal tone is high and HRV is elevated. Under conditions of physical stress, psychological stress, illness, sleep debt, or alcohol metabolism, sympathetic tone rises and HRV falls.
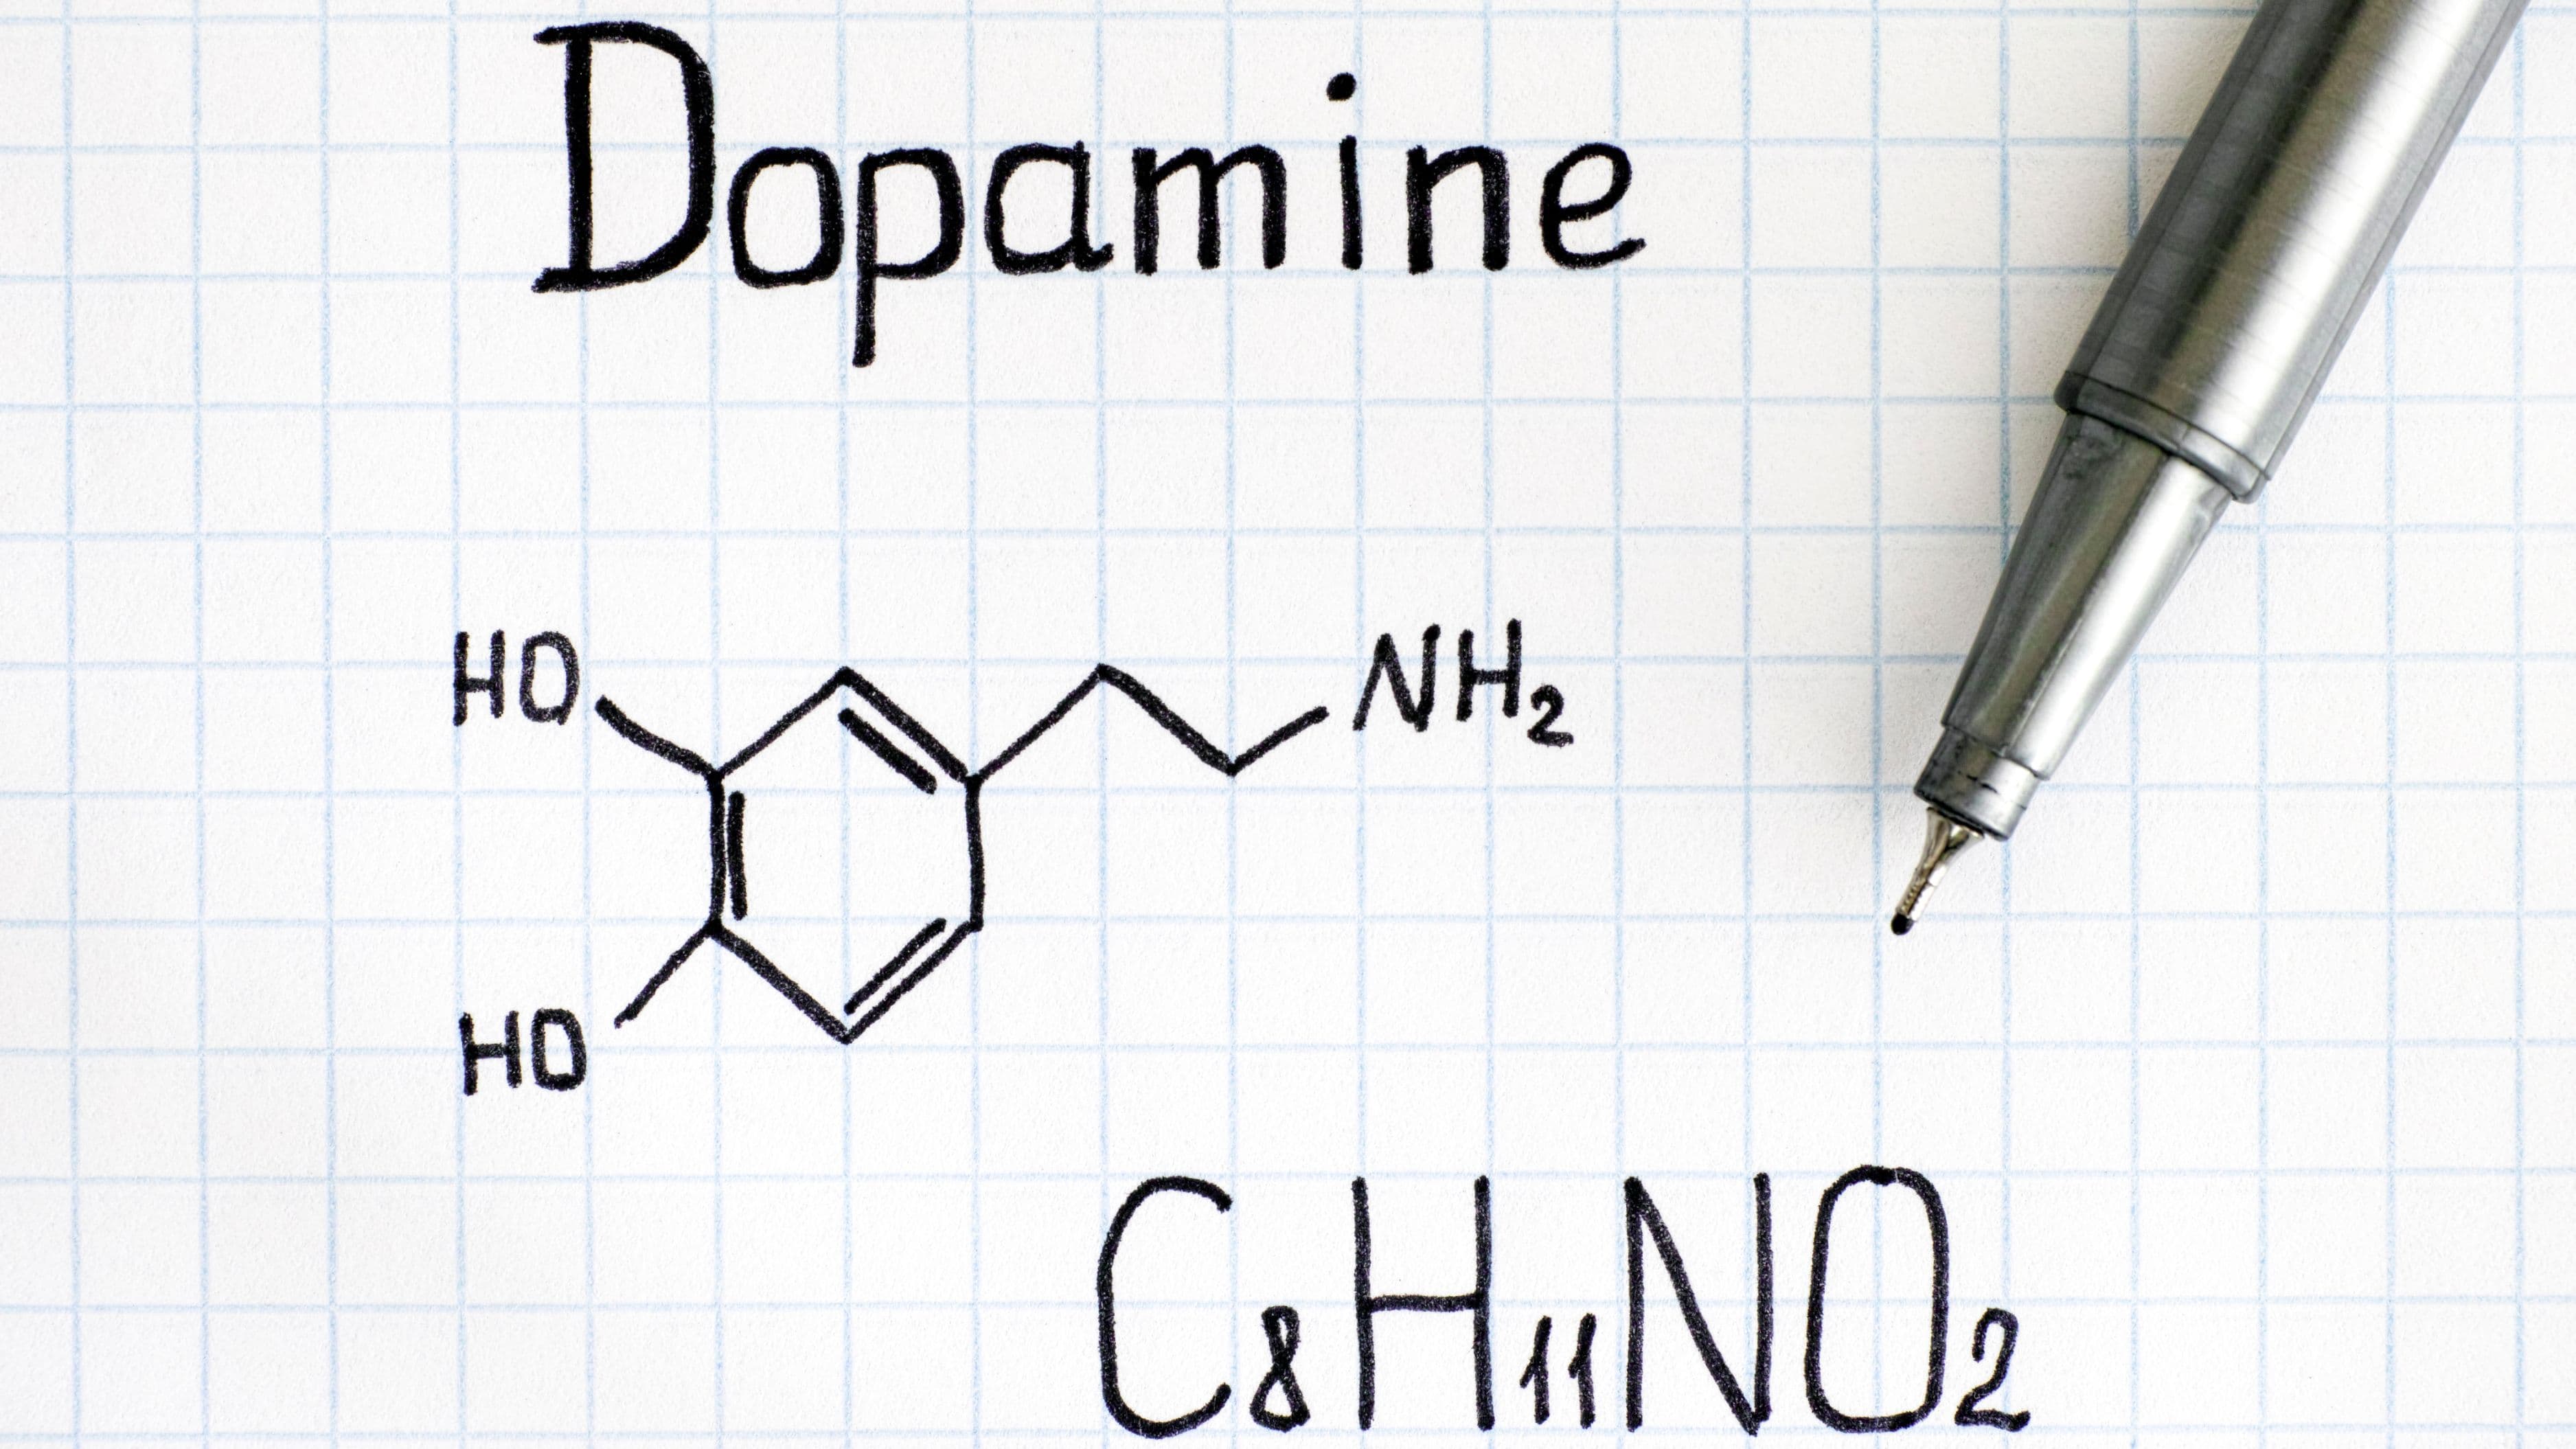
The connection to performance is direct. High HRV correlates with greater cardiac output reserve, better oxygen delivery efficiency, faster lactate clearance, and higher anaerobic threshold – all meaningful for athletic output. At a hormonal level, higher chronic HRV is associated with better testosterone-to-cortisol ratios and more responsive HPA axis regulation, which governs your stress response system. The same autonomic conditions that support recovery also support hormonal homeostasis.
Neurologically, HRV is linked to prefrontal cortex function. The polyvagal theory and subsequent research have established bidirectional connections between vagal tone and executive function, emotional regulation, and cognitive flexibility. This is why low HRV days often correlate with worse decision-making, lower frustration tolerance, and reduced cognitive performance – it's not coincidence, it's shared mechanism.
How to Measure It Correctly
HRV measurement quality varies significantly depending on method, timing, and consistency. Getting reliable data requires following a few non-negotiable protocols.
Timing: Measure immediately upon waking, before leaving bed, before consuming caffeine, and before any significant movement. Morning HRV reflects the accumulated autonomic state after sleep and is the most reproducible and comparable measurement across days. HRV measured at other times of day is more variable and harder to interpret as a trend.
Duration: A 1–5 minute reading is sufficient for RMSSD-based metrics. Longer readings don't meaningfully improve accuracy for consumer-grade tracking. What matters more is consistency – same timing, same position (supine or seated), every day.
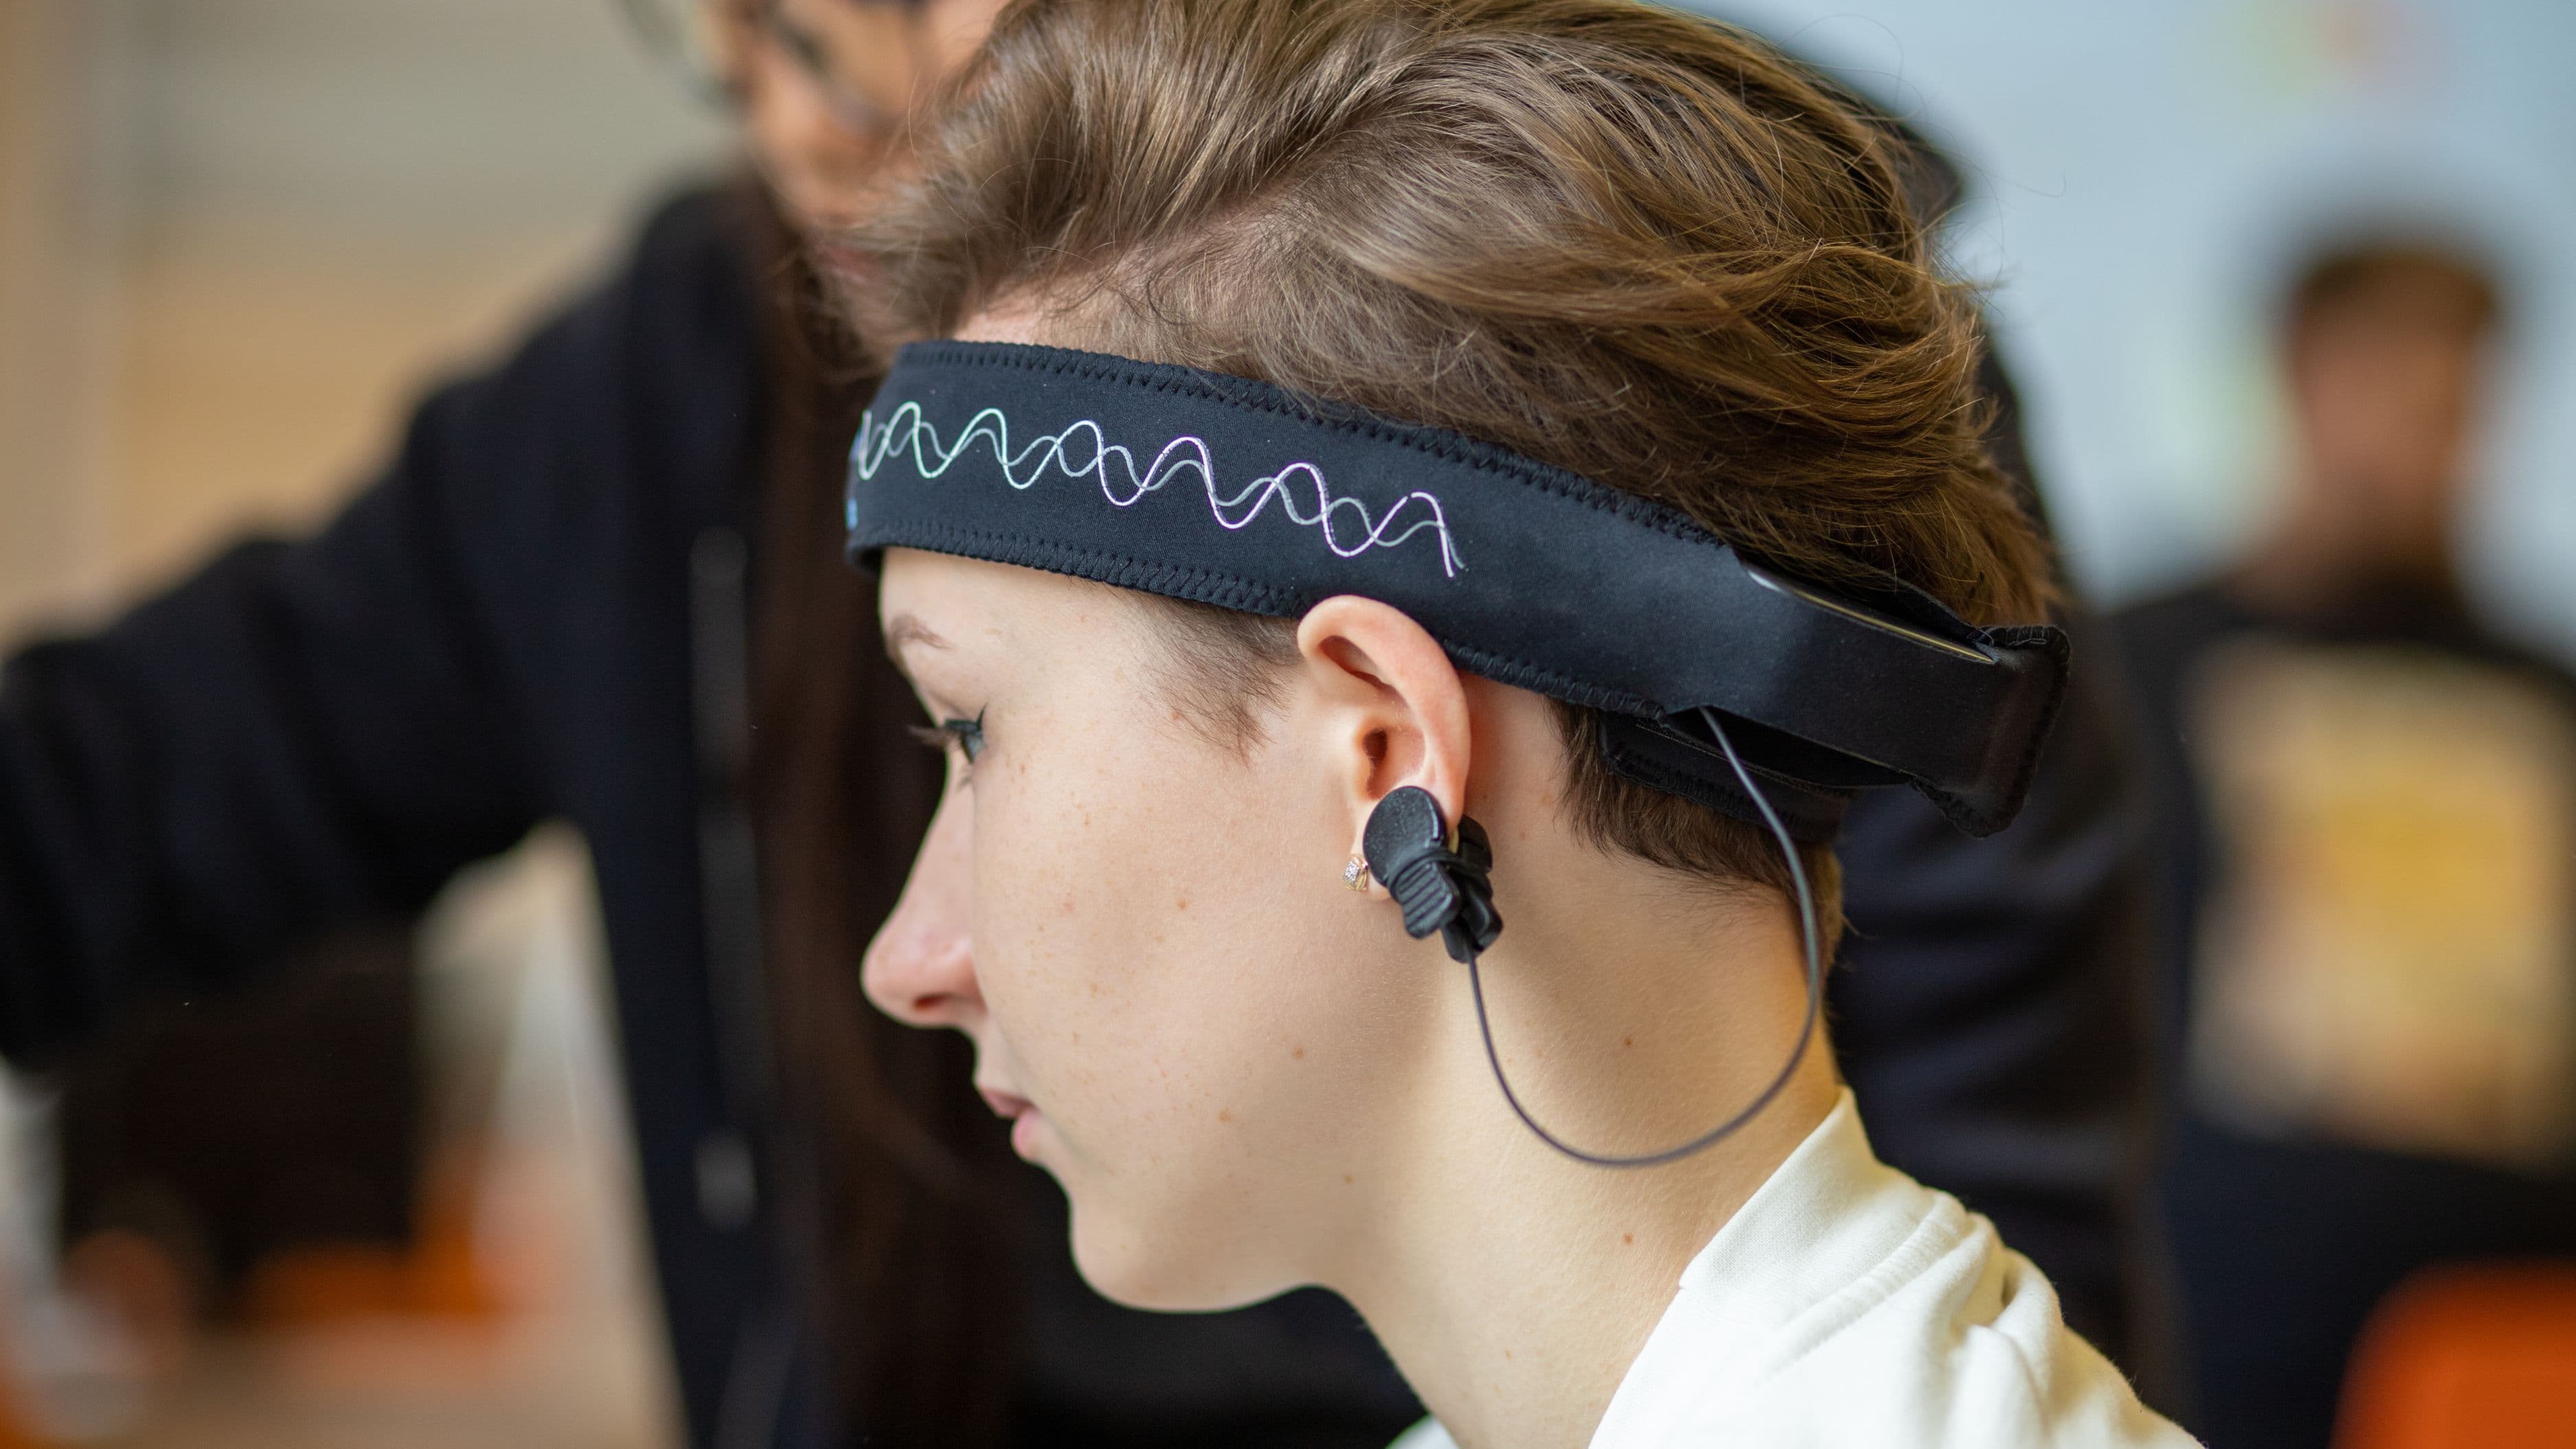
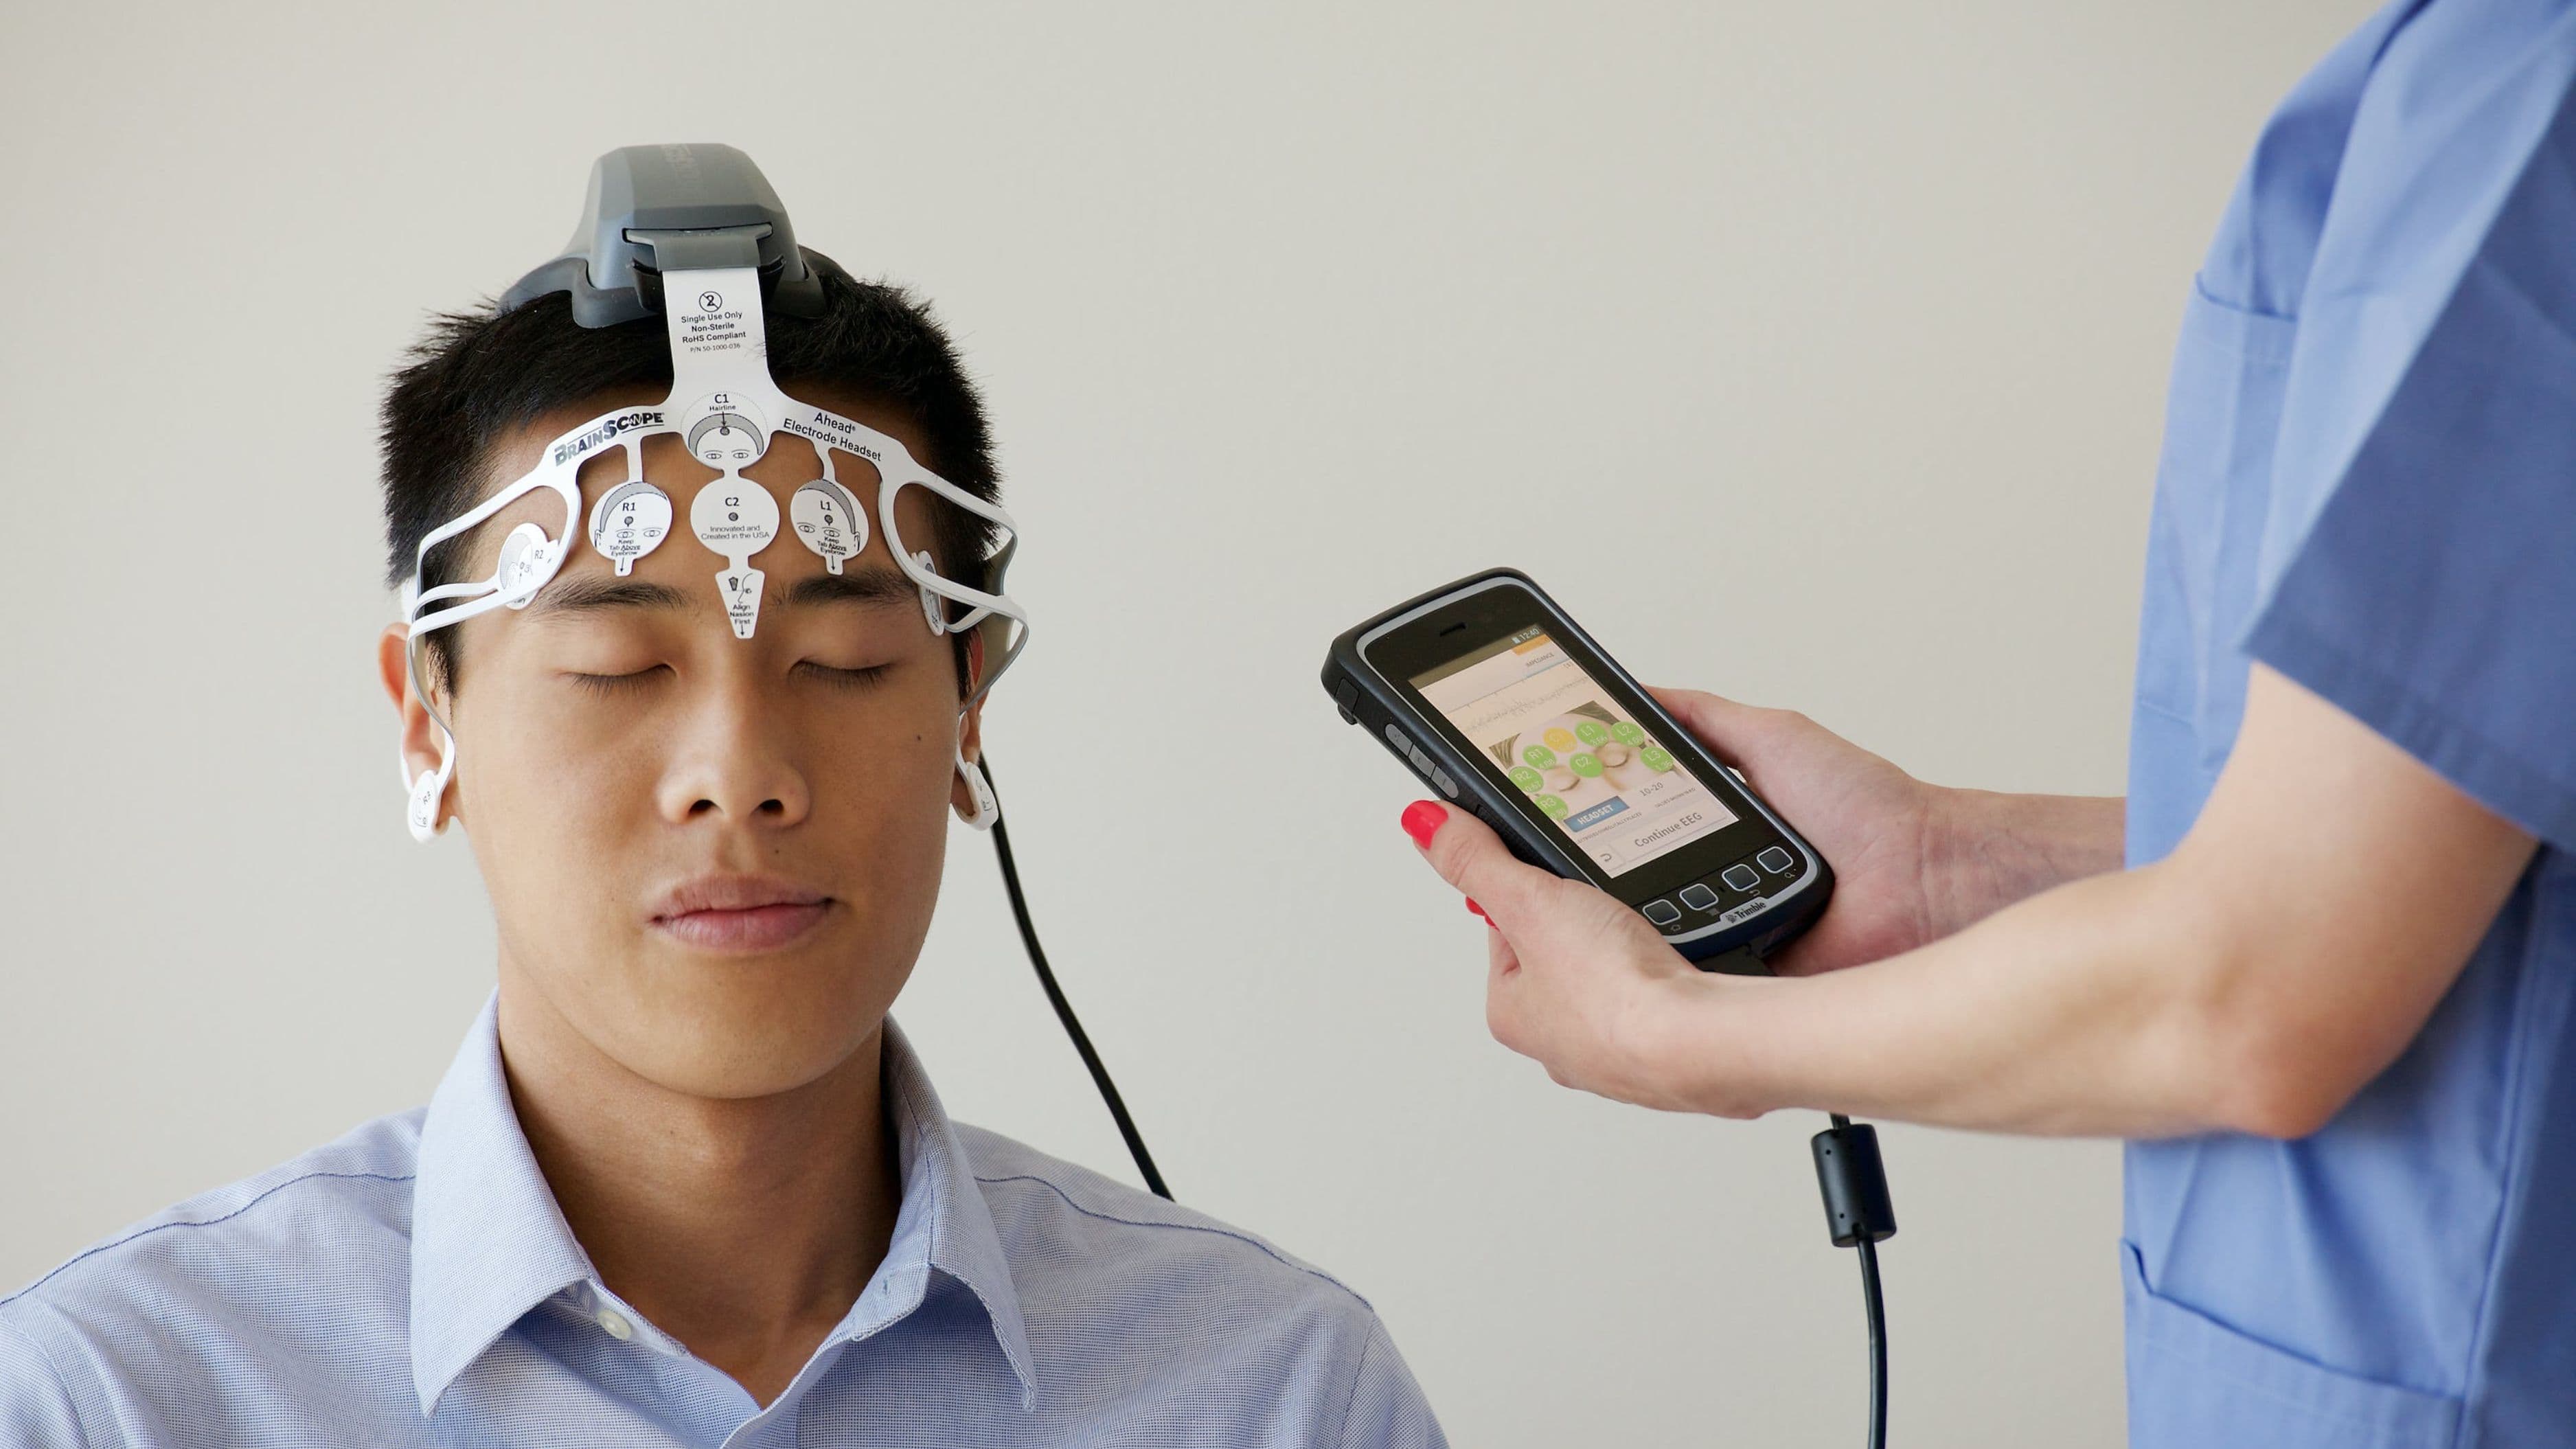
Hardware: Chest strap ECG sensors (Polar H10 is the gold standard for consumer use) are significantly more accurate than optical wrist-based sensors, which are subject to motion artifact and can miss beats, leading to inflated or deflated HRV readings. Wrist-based wearables have improved considerably, but if precision matters to you, a chest strap is worth the minor inconvenience.
Software: Elite HRV, Kubios HRV, and the Whoop app all provide reliable RMSSD calculation and trend tracking. The specific platform matters less than using the same one consistently – you're tracking relative change over time, not absolute values against a population norm.
Reading Your Trends, Not Your Daily Number
The most common mistake with HRV tracking is treating the daily number as a pass/fail test rather than reading the trend. A single low HRV morning is not informative in isolation. Your HRV will naturally fluctuate day-to-day based on minor variables. What matters is the 7–14 day rolling average and whether it's trending up, stable, or declining.
A declining trend over 5–10 days – even without individual numbers crossing any alarm threshold – is a reliable signal of accumulating load. This is where HRV earns its value. It can detect slow-building overreach before it becomes overtraining, flag the onset of illness before symptoms appear, and confirm that a deload week is producing the physiological recovery you intended.
Acute drops of 20% or more below your baseline on a given morning warrant attention. Common causes include alcohol consumption (even moderate amounts – 2–3 drinks suppress HRV for 24–48 hours), poor sleep quality, high training volume, elevated psychological stress, or early immune response. Use these drops as investigative prompts, not as alarms. The question is always: what's the systemic load right now, and what's the source?
Conversely, sustained upward trends in your baseline HRV are one of the cleaner signals of genuine adaptation – improved cardiovascular fitness, reduced systemic stress, better sleep quality, or positive hormonal changes. It's one of the few metrics that reflects long-term improvement in autonomic resilience in real time.
Practical Application: What to Do With the Data
HRV data without a decision framework is just numbers. Here's how to apply it.
Green day (HRV at or above your rolling average): Your autonomic system is recovered and ready. High-intensity training, heavy cognitive load, or strategic stressors will produce better adaptation than on a compromised day. Push when the data supports it.
Yellow day (HRV within 10–15% below your average): Moderate load is appropriate. Avoid maximal efforts or high-volume work. Prioritize technical skill work, moderate aerobic training, or active recovery. Investigate contributing factors – sleep quality, stress load, nutrition timing.
Red day (HRV significantly below your average, or acutely suppressed): Recovery-only protocols. Low-intensity movement, breathwork, cold exposure, or rest. Forcing hard training on a red day produces a worse training stimulus and a worse adaptation response than backing off. This is not mental weakness – it's evidence-based load management.
For hormonal optimization specifically: chronic low HRV is a flag for HPA axis dysregulation, which elevates cortisol and suppresses testosterone. If your HRV baseline is consistently low despite adequate sleep and training structure, the issue may be systemic stress load – and protocol adjustments (training volume, sleep hygiene, stress management, adaptogen use) should be evaluated before adding more aggressive interventions.
Variables That Move HRV – and How to Optimize It
Several evidence-backed interventions reliably raise HRV baseline over time.
Sleep quality is the single highest-leverage variable. Even one night of poor sleep suppresses HRV the following morning. Optimizing sleep architecture – temperature, darkness, consistent schedule, limiting alcohol – has the largest return on HRV investment of any intervention.
Aerobic base training raises chronic HRV by increasing parasympathetic tone and improving cardiac autonomic function. Zone 2 training (low-intensity, conversational-pace cardio) is particularly effective. Studies consistently show that chronic endurance training elevates resting HRV and vagal tone independent of age.
Cold exposure – cold showers or cold plunge – produces an acute sympathetic response followed by a parasympathetic rebound that can elevate HRV for hours afterward. Regular cold exposure appears to improve vagal tone over time, though the evidence for HRV-specific effects of cold is less robust than for sleep or aerobic training.
Controlled breathing protocols – specifically slow breathing at 4–6 breaths per minute – directly stimulate the baroreflex and increase vagal tone. Even 5 minutes of slow-paced breathing before your morning HRV measurement will temporarily elevate the reading, which is why protocol consistency matters. As an ongoing practice, slow breathing or HRV biofeedback is one of the more evidence-backed methods for increasing baseline vagal tone.
Alcohol is one of the most reliable suppressors of HRV, even in modest amounts. If you consume alcohol and wonder why your HRV is poor the following morning, the answer is straightforward: alcohol disrupts sleep architecture, suppresses parasympathetic tone, and elevates inflammatory markers, all of which register in your HRV. There's no optimization protocol that offsets this.
Limitations and What HRV Can't Tell You
HRV is not a complete picture of your health or performance. Several important caveats:
It doesn't distinguish the source of autonomic suppression. A low HRV could reflect hard training, poor sleep, psychological stress, alcohol, illness, or all of the above. The metric signals load – it doesn't diagnose cause. You need to pair the number with context.
Individual baselines vary enormously. HRV is highly personal and age-dependent; a baseline of 45ms and a baseline of 90ms can both be healthy depending on the individual. Never compare your absolute number to someone else's – track your own trend.
Consumer wearables, despite improvement, still introduce measurement error. Optical sensors on the wrist are susceptible to poor contact, motion artifact, and beat misdetection. If your wearable gives you readings that seem inconsistent or implausible, consider validating against a chest strap periodically.
HRV also doesn't replace hormonal testing. It can signal that something is off hormonally, but it can't tell you whether testosterone is low, cortisol is elevated, or thyroid is dysregulated. Use HRV to guide the frequency and urgency of deeper testing, not to replace it.
FAQ
What's a good HRV score for a man in his 30s or 40s? There's no universal target. Average RMSSD values for men in their 30s typically range from 35–80ms; for men in their 40s, 30–65ms is more common. These ranges widen considerably with fitness level. What matters is your personal baseline trend – not where you sit relative to population averages.
How quickly does HRV respond to lifestyle changes? Acute changes (alcohol, sleep, stress) register within 24–48 hours. Structural improvements from consistent training, better sleep, or stress reduction typically show in a rising baseline over 4–8 weeks. HRV biofeedback and breathing protocols can show faster effects on resting parasympathetic tone.
Should I train when my HRV is low? It depends on how low and for how long. A moderate dip for one day – adjust intensity but don't skip training entirely. A sustained low trend over 7–10 days – reduce volume and intensity significantly, prioritize sleep and recovery, and investigate the cause before continuing high loads.
Does HRV predict illness before symptoms appear? Often, yes. A significant HRV drop with no clear behavioral explanation (alcohol, hard training, poor sleep) is frequently a precursor to illness by 24–48 hours, reflecting early immune activation before symptoms manifest. Treat these readings as a cue to reduce training load and prioritize sleep.
The Only Metric That Doesn't Lie to You
Most tracking metrics reflect inputs – what you did, how long you slept, how many steps you took. HRV reflects output – how your body is actually responding to everything you're doing. That's a meaningfully different kind of data, and it's why serious performers across athletic, cognitive, and hormonal optimization contexts have made it a non-negotiable part of their daily protocol.
Track it consistently, read it in trends, and build decision rules around it. Used correctly, it removes guesswork from the most important recovery and load management decisions you make.
📚 Sources
Shaffer, F., & Ginsberg, J. P. (2017). An overview of heart rate variability metrics and norms. Frontiers in Public Health – https://www.frontiersin.org/articles/10.3389/fpubh.2017.00258/full
Plews, D. J. et al. (2013). Training adaptation and heart rate variability in elite endurance athletes: Opening the door to effective monitoring. Sports Medicine – https://link.springer.com/article/10.1007/s40279-013-0071-8
Malik, M. et al. (1996). Heart rate variability: Standards of measurement, physiological interpretation, and clinical use. European Heart Journal – https://academic.oup.com/eurheartj/article/17/3/354/503893
Thayer, J. F., & Lane, R. D. (2009). Claude Bernard and the heart-brain connection: Further elaboration of a model of neurovisceral integration. Neuroscience & Biobehavioral Reviews – https://www.sciencedirect.com/science/article/abs/pii/S0149763408001607
Stein, P. K., & Pu, Y. (2012). Heart rate variability, sleep and sleep disorders. Sleep Medicine Reviews – https://www.sciencedirect.com/science/article/abs/pii/S1087079211000627
Kiviniemi, A. M. et al. (2007). Cardiac autonomic function and high-intensity interval training in middle-age men. Medicine & Science in Sports & Exercise – https://journals.lww.com/acsm-msse/Abstract/2007/11000/Cardiac_Autonomic_Function_and_High_Intensity.3.aspx
Quintana, D. S. et al. (2016). Vagally-mediated heart rate variability is associated with cognitive flexibility. Scientific Reports – https://www.nature.com/articles/srep26479
🔍 Explore Related Topics